A key element of BlueScope’s Financial Framework is to maintain strong financial capacity, so we can robustly weather industry and economic cycles and deliver on opportunities to build value and deliver returns to shareholders.
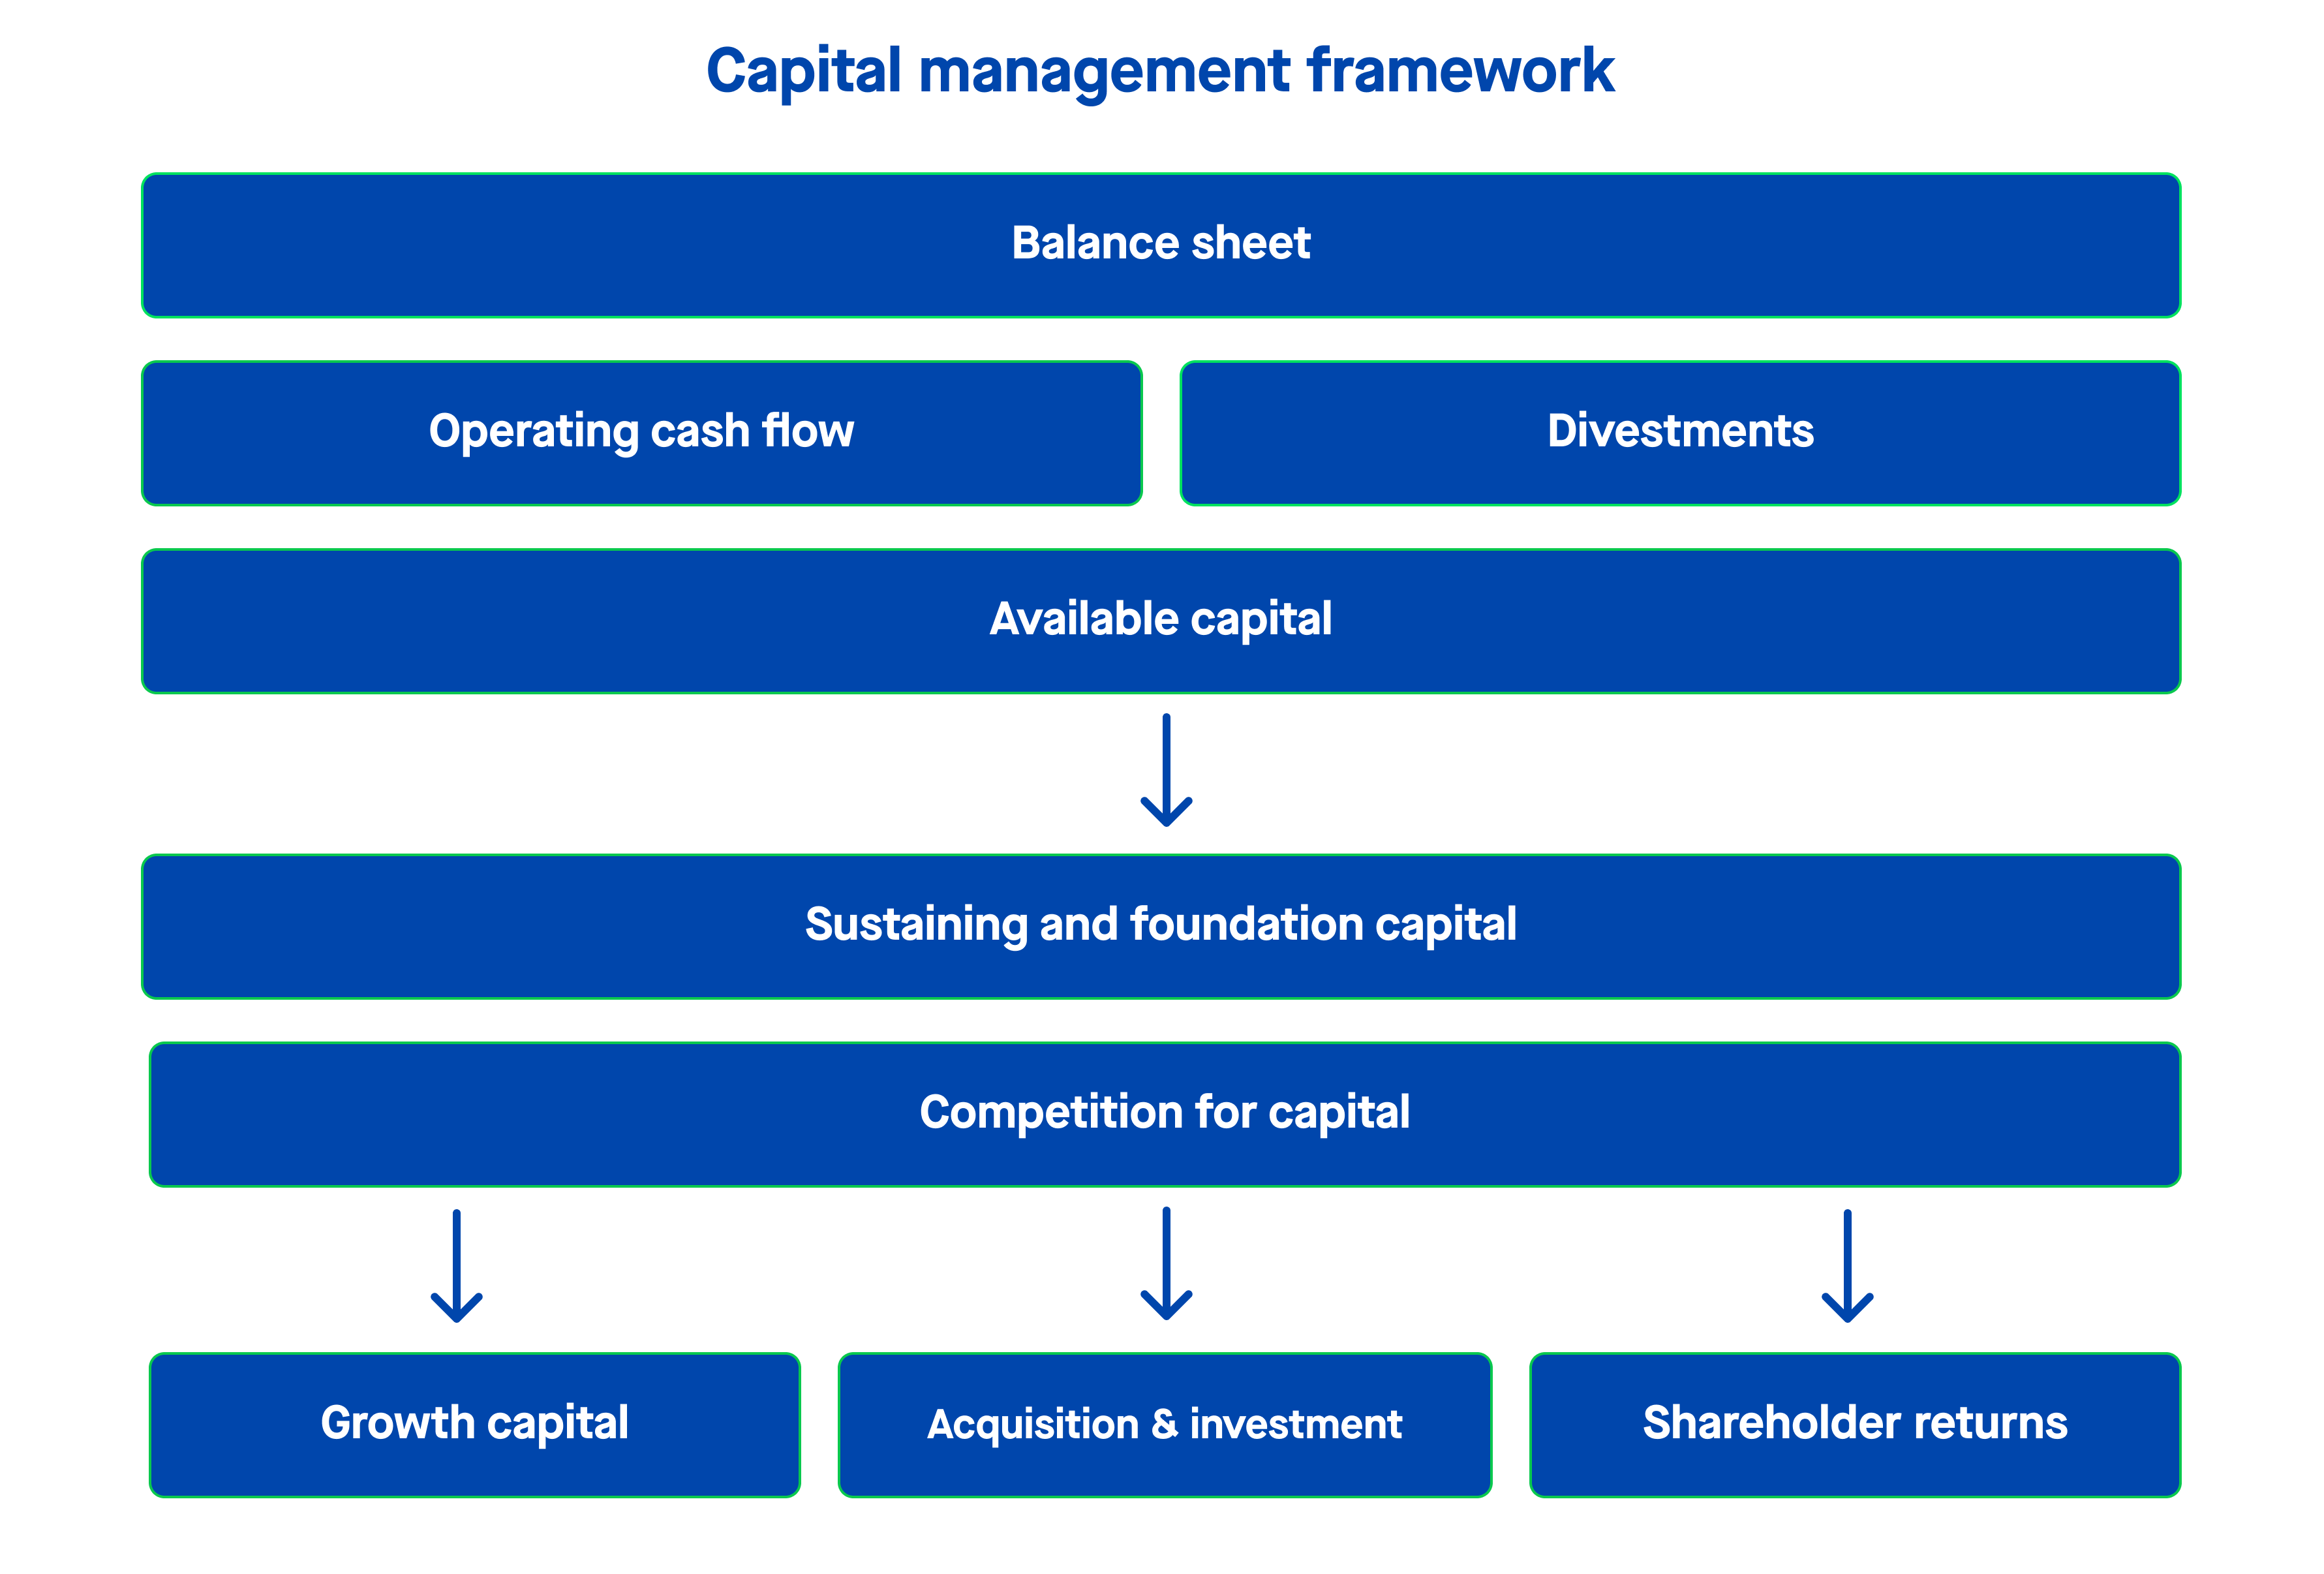
Our capital management framework operates a returns-focussed process with disciplined competition for capital, balancing shareholder returns and long-term profitable growth, while seeking to retain strong credit metrics, and a resilient balance sheet.
Given this approach, and in line with Our Financial Framework, our current policy is to distribute at least 50% of free cash flow to shareholders as consistent dividends and buy-backs.
We seek to use on-market share buy-backs to supplement paying consistent dividends. Buy-backs are attractive given their flexibility in managing capital and for the contribution they can deliver to Earnings Per Share. The timing and value of shares purchased will depend on factors such as the prevailing market conditions and share price.
Half year | Shares bought (M) | Consideration ($M) | Average price ($/sh) |
---|---|---|---|
1H FY2025 | 1.5 | $30M | $20.46 |
2H FY2024 | 5.8 | $130M | $22.34 |
1H FY2024 | 9.7 | $193M | $19.96 |
2H FY2023 | 8.4 | $165M | $19.56 |
1H FY2023 | 7.4 | $120M | $16.19 |
2H FY2022 | 18.8 | $353M | $18.74 |
1H FY2022 | 13.6 | $285M | $20.94 |
2H FY2021 | - | - | - |
1H FY2021 | - | - | - |
2H FY2020 | 2.9 | $34M | $11.86 |
1H FY2020 | 14.6 | $186M | $12.68 |
2H FY2019 | 17 | $217M | $12.81 |
1H FY2019 | 18.9 | $293M | $15.50 |
2H FY2018 | 9.2 | $152M | $16.50 |
1H FY2018 | 12 | $148M | $12.37 |
2H FY2017 | 12.8 | $150M | $11.74 |
TOTAL | 152.5 | $2,455M | $16.09 |
More information on our latest buy-back program is available in our financial results announcements.
The BlueScope Steel Limited Dividend Reinvestment Plan (DRP) is not active.
Since August 2021 it has been the Board’s intention to target annual ordinary dividends of 50 cents per share per annum, that is 25 cents per share per half year. The annual dividend per share paid is subject to the Company’s financial performance, business conditions, growth opportunities, capex and working capital requirements and the determination of the Board determination at the relevant time.
Year | Dividend | Record date | Payment date | Cents per share (reported unadj.) | Cents per share (adj. for cons.) | Franking | DRP issue price |
---|---|---|---|---|---|---|---|
FY2025 | Interim | 24 Feb 25 | 25 Mar 25 | 30 cents | 30.0 cents | 100% | Not active |
FY2024 | Final Interim | 11 Sep 24 26 Feb 24 | 15 Oct 24 26 Mar 24 | 30 cents 25 cents | 30.0 cents 25.0 cents | 100% 100% | Not active Not active |
FY2023 | Final Interim | 13 Sep 23 27 Feb 23 | 17 Oct 23 28 Mar 23 | 25 cents 25 cents | 25.0 cents 25.0 cents | 100% 100% | Not active Not active |
FY2022 | Final Interim | 7 Sep 22 28 Feb 22 | 12 Oct 22 29 Mar 22 | 25 cents 25 cents | 25.0 cents 25.0 cents | 0% 0% | Not active Not active |
FY2021 | Special Final Interim | 8-Sep-21 8-Sep-21 1-Mar-21 | 13-Oct-21 13-Oct-21 30-Mar-21 | 19 cents 25 cents 6 cents | 19.0 cents 25.0 cents 6.0 cents | 0% 0% | Not active Not active |
FY2020 | Final Interim | 9-Sep-20 2-Mar-20 | 14-Oct-20 31-Mar-20 | 8 cents 6 cents | 8.0 cents 6.0 cents | 0% 0% | Not active Not active |
FY2019 | Final Interim | 12-Sep-19 4-Mar-19 | 16-Oct-19 2-Apr-19 | 8 cents 6 cents | 8.0 cents 6.0 cents | 0% 0% | Not active Not active |
FY2018 | Final Interim | 10-Sep-18 5-Mar-18 | 16-Oct-18 3-Apr-18 | 8 cents 6 cents | 8.0 cents 6.0 cents | 0% 50% | Not active Not active |
FY2017 | Final Interim | 11-Sep-17 3-Mar-17 | 16-Oct-17 31-Mar-17 | 5 cents 4 cents | 5.0 cents 4.0 cents | 100% 100% | Not active Not active |
FY2016 | Final Interim | 12-Sep-16 4-Mar-16 | 10-Oct-16 31-Mar-16 | 3 cents 3 cents | 3.0 cents 3.0 cents | 100% 100% | Not active Not active |
FY2015 | Final Interim | n/a n/a | n/a n/a | 0 cents 0 cents | 0.0 cents 0.0 cents | n/a n/a | Not active Not active |
FY2014 | Final Interim | n/a n/a | n/a n/a | 0 cents 0 cents | 0.0 cents 0.0 cents | n/a n/a | Not active Not active |
FY2013 | Final Interim | n/a n/a | n/a n/a | 0 cents 0 cents | 0.0 cents 0.0 cents | n/a n/a | Not active Not active |
FY2012 | Final Interim | n/a n/a | n/a n/a | 0 cents 0 cents | 0.0 cents 0.0 cents | n/a 100% | Not active Not active |
FY2011 | Final Interim | n/a 4-Mar-11 | n/a 4-Apr-11 | 0 cents 2 cents | 0.0 cents 10.4 cents | 100% 100% | Not active Not active |
FY2010 | Final Interim | 24-Sep-10 n/a | 20-Oct-10 n/a | 5 cents 0 cents | 25.4 cents 0.0 cents | 100% 100% | $2.19 Not active |
FY2009 | Final Interim | n/a 4-Mar-09 | n/a 31-Mar-09 | 0 cents 5 cents | 0.0 cents 20.4 cents | n/a 100% | Not active $2.26 |
FY2008 | Final Interim | 26-Sep-08 5-Mar-08 | 22-Oct-08 1-Apr-08 | 27 cents 22 cents | 110.0 cents 89.6 cents | 100% 100% | $6.79 $9.37 |
FY2007 | Final Interim | 28-Sep-07 7-Mar-07 | 23-Oct-07 2-Apr-07 | 26 cents 21 cents | 105.9 cents 85.5 cents | 100% 100% | $10.83 $9.35 |
FY2006 | Final Interim | 4-Oct-06 6-Mar-06 | 24-Oct-06 3-Apr-06 | 24 cents 20 cents | 97.8 cents 81.5 cents | 100% 100% | $10.83 $9.35 |
FY2005 | Special Final Interim | 5-Oct-05 5-Oct-05 4-Mar-05 | 24-Oct-05 24-Oct-05 4-Apr-05 | 20 cents 24.0 cents 18.0 cents | 81.5 cents 97.8 cents 73.3 cents | 100% 100% 100% | Not active Not active Not active |
FY2004 | Special Final Interim | 5-Oct-04 5-Oct-04 2-Mar-04 | 18-Oct-04 18-Oct-04 29-Mar-04 | 10.0 cents 18.0 cents 12.0 cents | 40.7 cents 73.3 cents 48.9 cents | 100% 100% 100% | Not active Not active Not active |
FY2003 | Special Final Interim | 16-Sep-03 16-Sep-03 18-Mar-03 | 10-Oct-03 10-Oct-03 22-Apr-03 | 7.0 cents 13.0 cents 9.0 cents | 28.5 cents 53.0 cents 36.7 cents | 100% 100% 100% | Not active Not active Not active |
Below you will find some general information regarding the capital gains tax cost base for BlueScope Steel shares.
Looking for something else?
BlueScope is a registered trademark of BlueScope Steel Limited.